
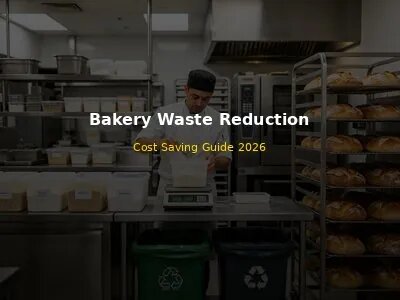
A story from our customer in Portland, USA: "We were a typical retail bakery wasting about 12% of everything we produced — day-old bread, burnt pastries, misshapen loaves, spilled flour. It was just part of doing business, or so we thought. Then we started tracking waste seriously. We set up a waste log, weighed everything we threw away, and look atd the data. What we found shocked us: we were wasting $3,200 worth of product every single month — that's $38,400 per year, straight into the dumpster. We put in placeed a systematic waste reduction program: data-driven production planning (reduced overproduction by 40%), FIFO inventory rotation (reduced expired ingredients by 60%), portion control with digital scales (reduced portion waste by 30%), employee training (reduced production errors by 25%), and a donation program for unsold bread (turned waste into tax deductions and community goodwill). Within 6 months, we reduced total waste from 12% to 4.5%, saving $2,000/month ($24,000/year). That money went straight to our bottom line — no additional sales needed. Waste reduction is the easiest profit improvement program You can put in place in a bakery. It doesn't require more customers, more sales, or more marketing — it just requires discipline, systems, and a commitment to measuring and improving. Every bakery should be doing this."
Waste is one of the biggest profit drains in the bakery industry. The typical bakery wastes 5-15% of its total food production, and some bakeries waste up to 20-30%. For a bakery with $500,000/year in revenue, 10% waste represents $50,000/year in lost revenue — and even more in wasted labor, energy, and overhead. Reducing waste from 10% to 5% can add $25,000/year directly to the bottom line. That's pure profit, with no additional sales or marketing required.
There's a common misconception in the bakery industry that more expensive = better. After installing equipment in 27 countries, we can tell you that's simply not true.
1. Understanding the True Cost of Waste
Before You can reduce waste, You should understand its true cost. Waste is not just the cost of the ingredients — it includes labor, energy, overhead, and opportunity cost.
1.1 The Full Cost of Bakery Waste
| Cost Part | Description | Typical % of Total Waste Cost |
|---|---|---|
| Ingredient cost | Cost of flour, yeast, sugar, butter, eggs, fillings, etc. in wasted products | 30-40% |
| Labor cost | Wages paid to employees who produced the wasted product (mixing, shaping, baking, packaging) | 25-35% |
| Energy cost | Gas/electricity for mixing, proofing, baking, cooling, refrigeration of wasted products | 5-10% |
| Packaging cost | Cost of bags, boxes, labels, twist ties for wasted products | 3-5% |
| Overhead allocation | Rent, insurance, equipment depreciation, administrative costs allocated to wasted production | 10-15% |
| Opportunity cost | Profit that could have been earned if the production capacity used for wasted product had been used for sellable product | 5-10% |
Important insight: The ingredient cost is only 30-40% of the total cost of waste. When you waste a loaf of bread that cost $1.50 in ingredients, the true cost to your business is $3.75-$5.00 when you include labor, energy, packaging, overhead, and opportunity cost. This means waste reduction has an even bigger impact on profitability than most bakery owners realize.
1.2 Waste Cost Calculation Example
Real Example: $500K/year Bakery
Current state: $500,000/year revenue, 10% waste rate
Annual waste cost: $500,000 × 10% = $50,000/year (revenue value)
True cost of waste: $50,000 × 2.5 (multiplier for labor, energy, overhead) = $125,000/year
After waste reduction (10% → 5%):
Annual waste cost: $500,000 × 5% = $25,000/year
True cost savings: ($50,000 - $25,000) × 2.5 = $62,500/year in true cost savings
Bottom line impact: $62,500/year directly added to profit — with no additional sales needed!
2. Tracking and Measuring Waste
You can't manage what you don't measure. The first step in any waste reduction program is to set up a system for tracking and measuring waste. See our FAQ section above for a detailed waste tracking method.
2.1 Waste Tracking System Setup
- Create a waste log: Use a spreadsheet or dedicated software with columns for: date, waste category (ingredient, production, overproduction, packaging, other), product/ingredient name, quantity (weight in grams/kg or count), reason for waste, estimated cost, and notes.
- Place scales near waste bins: Put digital scales near production areas, packaging area, and retail display. Train employees to weigh and log all waste.
- Assign responsibility: Designate a production manager or shift supervisor to oversee waste tracking and ensure consistency.
- Make it part of daily routine: Waste tracking should be as routine as cleaning — not an afterthought. Incorporate it into shift start/end procedures.
- look over data regularly: Weekly team meetings to look over waste data, spot issues, and set improvement goals. Monthly management look over to track progress and calculate cost savings.
2.2 Important Waste Metrics to Track
- Total waste percentage: (Total waste cost ÷ Total production cost) × 100. Target: under 5% for well-managed bakeries.
- Waste by category: Ingredient waste, production waste, overproduction waste, packaging waste. spot the largest category and focus there first.
- Waste by product: Which products have the highest waste rates? Focus on reducing waste for the top 3-5 waste-generating products.
- Waste by shift: Which shift produces the most waste? May indicate training or supervision issues.
- Waste by employee: Which employees produce the most waste? May indicate training needs (handle sensitively — don't use for punishment, use for coaching).
- Monthly waste cost: Total dollar value of waste per month. Track trend over time.
- Waste reduction progress: Compare current waste rate to baseline. Celebrate improvements and share results with the team.
3. Reducing Overproduction (The #1 Cause of Bakery Waste)
Overproduction — baking more products than can be sold — is the single largest cause of bakery waste, especially for retail bakeries. Reducing overproduction requires shifting from guesswork-based production to data-driven production planning. See our FAQ section above for detailed overproduction reduction strategies.
3.1 Data-Driven Production Planning
- Track sales history: Maintain at least 4-6 weeks of daily sales data by product and day of week. Use your POS system or a simple spreadsheet.
- Calculate average sales: For each product, calculate average daily sales for the same day of week over the past 4-6 weeks. This is your baseline forecast.
- Adjust for known factors: Upcoming holidays, local events, weather forecast, promotions, catering orders, and recent trends (increasing or decreasing sales).
- Use the 10% buffer rule: Production forecast = (Average sales × 1.1) + Known orders. The 10% buffer ensures you don't run out, but minimizes overproduction.
- Stagger baking throughout the day: Don't bake everything at once in the morning. Bake in smaller batches throughout the day from when products sell best.
- Monitor and adjust in real-time: Have a supervisor monitor sales throughout the day and adjust production — bake more if selling fast, reduce/cancel batches if selling slow.
- Embrace running out: Running out of 10-15% of products by end of day indicates optimal production. If you never run out, you're overproducing. Running out costs less than overproduction.
Overproduction Savings Example
Retail bakery, 20 products, average 50 units/product/day
Current overproduction: 15% = 150 units/day wasted
Average food cost per unit: $1.20
Daily overproduction cost: 150 × $1.20 = $180/day
Annual cost: $180 × 300 days = $54,000/year
After data-driven planning (15% → 7%):
Annual savings: $54,000 × (15-7)/15 = $28,800/year
True cost savings (with labor/energy multiplier): $28,800 × 2.5 = $72,000/year!
4. Inventory Management and FIFO Rotation
Poor inventory management is the second largest cause of bakery waste — ingredients expiring before use, improper storage, and not using first-in-first-out (FIFO) rotation.
4.1 FIFO (First-In, First-Out) System
- Label all ingredients with delivery date: When ingredients arrive, label each container/bag with the delivery date and use-by date. Use removable labels or a marker.
- Rotate stock when receiving: When new inventory arrives, move older stock to the front and place new stock behind it. This ensures older ingredients are used first.
- Train all employees on FIFO: Make FIFO a non-negotiable rule. Every employee who handles ingredients must follow FIFO — no exceptions.
- Conduct weekly inventory checks: Check expiration dates weekly. Use ingredients approaching expiration first. Create a "use first" bin for ingredients expiring within 1-2 weeks.
- Organize storage by category: Group similar ingredients together (flours, sugars, fats, dairy, etc.) with clear labels. This makes it easy to find and rotate ingredients.
4.2 Proper Storage Techniques
| Ingredient Type | Storage Method | Shelf Life | Waste Prevention Tips |
|---|---|---|---|
| Flour (all-purpose, bread, whole wheat) | Cool, dry, dark place in airtight container | 3-6 months (white), 1-3 months (whole wheat) | Buy in bulk but use within shelf life; store whole wheat in fridge/freezer to extend |
| Yeast (active dry, instant) | Air-tight container in fridge or freezer | 4 months (fridge), 6 months (freezer) | Buy in vacuum-sealed packs; test yeast viability before use; let come to room temp before using |
| Sugar (white, brown, powdered) | Cool, dry place in airtight container | Indefinite (white), 4-6 months (brown) | Keep brown sugar soft with bread slice or terra cotta disk; prevent moisture contamination |
| Butter/margarine | Refrigerator (34-38°F) or freezer | 1-3 months (fridge), 6-12 months (freezer) | Buy in bulk and freeze; rotate FIFO; keep well-wrapped to prevent absorption of odors |
| Eggs | Refrigerator (33-40°F), in original carton | 3-5 weeks from purchase | Check freshness with water test (fresh eggs sink); use oldest first; don't wash until ready to use |
| Milk/cream | Refrigerator (34-38°F), back of fridge (not door) | 5-7 days (milk), 1-2 weeks (cream) | Buy in quantities you'll use; check expiration dates; use UHT for extended shelf life if needed |
| Fruits (fresh) | Refrigerator (most), counter (some: bananas, tomatoes) | 3-7 days (most), 1-2 weeks (citrus, apples) | Buy ripe and unripe; use ripe first; consider frozen for fillings (cheaper, longer shelf life) |
| Nuts/seeds | Air-tight container in fridge or freezer | 3-6 months (fridge), 6-12 months (freezer) | Nuts go rancid quickly at room temp; buy in small quantities; toast before use to revive flavor |
| Chocolate | Cool, dry place (60-70°F), air-tight container | 1-2 years (dark), 6-12 months (milk/white) | Avoid temperature fluctuations (causes bloom); don't refrigerate (condensation); chop and freeze leftovers |
4.3 Inventory Management Best Practices
- Set par levels: For each ingredient, set a par level (minimum quantity to keep on hand) and reorder point (when to order more). This prevents both over-ordering and stockouts.
- Order from usage, not guesswork: Track how much of each ingredient you use per week/month. Order from actual usage data, not on "we probably need more."
- Build relationships with suppliers: Work with suppliers who offer flexible ordering, good prices, reliable delivery, and fair return policies for expired/damaged goods.
- Use it up before it goes bad: When an ingredient is approaching expiration, plan to use it in upcoming production. Create a "use first" list and share with the production team.
- Consider frozen/dried alternatives: For ingredients with short shelf life (fruits, herbs, dairy), consider frozen or dried alternatives that have longer shelf life and are often cheaper.
- Conduct monthly inventory look overs: Physically count all inventory monthly. Compare with records to spot discrepancies (theft, spillage, recording errors). Adjust par levels from actual usage.
5. Portion Control and Standardized Recipes
Inconsistent portioning is a notable source of waste — products that are too large waste ingredients, and products that are too small can't be sold. Standardized recipes and portion control remove this waste.
5.1 Standardized Recipe System
- Document every recipe: Create a recipe manual with exact ingredient weights (not volumes — cups are inconsistent), mixing instructions, dough temperature, proofing time/temp, baking time/temp, yield, and portion size.
- Use weight, not volume: Always measure ingredients by weight (grams/ounces), not volume (cups/tablespoons). Volume measurements are inconsistent (a cup of flour can vary by 15-20% depending on packing). Digital scales are inexpensive and a must.
- Calibrate equipment regularly: Calibrate digital scales monthly (use a known weight). Calibrate dough dividers/rounders weekly (check that divided pieces are within ±2% of target weight). Calibrate oven temperatures monthly (use an oven thermometer).
- Use portioning tools: Use dough dividers, portion scoops, digital scales, and molds to ensure consistent portion sizes. Hand-portioned products are 2-3 times more variable than machine-portioned products.
- Train employees on recipes: Every employee must follow the exact recipe — no "eyeballing" or "this is how I've always done it." Test employees on recipe knowledge during training.
- Conduct regular quality checks: Check portion weights throughout production (every 30 minutes for high-volume products). If portions are outside the acceptable range (±2%), adjust and retrain.
5.2 Portion Control Savings
Portion Control Savings Example
Bakery producing 1,000 loaves/day, target dough weight 500g
Current average portion: 520g (4% over target Because of hand-portioned inconsistency)
Daily ingredient waste: 1,000 × 20g = 20,000g = 20kg/day
Flour cost: $1.50/kg → 20kg × $1.50 = $30/day in wasted flour alone
Annual flour waste: $30 × 300 days = $9,000/year
After portion control (520g → 502g, within ±0.4%):
Annual savings: $9,000 × (18/20) = $8,100/year in flour alone
Total savings (all ingredients + labor + consistency): $15,000-$25,000/year
6. Quality Control to Reduce Production Errors
Production errors — burnt products, misshapen loaves, dough that doesn't rise, over-mixed dough — are a notable source of waste. A solid quality control system catches errors early (when less has been invested) and prevents recurring problems.
6.1 In-Process Quality Checks
| Production Stage | Quality Check | Frequency | Action if Fails |
|---|---|---|---|
| Mixing | Dough temperature (target: 24-28°C), dough consistency, mixing time | Every batch | Adjust water temp, mixing time; don't proceed if dough is clearly defective |
| Dividing | Portion weight (within ±2% of target), number of pieces | Every 30 min | Recalibrate divider, re-divide off-weight pieces |
| Shaping | Shape consistency, seam placement, surface smoothness | Every batch | Retrain operator, adjust moulder settings |
| Proofing | Proof level (doubled in size, spring test), proofing temp/humidity | Every load | Adjust proofing time/temp; don't under-proof or over-proof |
| Baking | Oven temperature (use thermometer), bake time, color, internal temp | Every load | Adjust oven temp/time; pull under-baked loaves and return; discard burnt products |
| Cooling | Cooling time (to room temp before packaging), handling (no damage) | Every batch | Extend cooling time, improve handling procedures |
| Packaging | Package integrity, label accuracy, product appearance, weight | Every 30 min | Repackage, relabel, discard defective products |
6.2 Root Cause Analysis for Recurring Problems
When a quality problem occurs repeatedly, conduct a root cause analysis to spot and fix the underlying issue, not just the symptom:
- Define the problem: What exactly is happening? (e.g., "15% of sourdough loaves are coming out misshapen")
- Measure the problem: How often does it occur? When does it occur? Which products/shifts/employees are affected?
- spot possible causes: Brainstorm all possible causes (equipment, ingredients, process, people, environment). Use the "5 Whys" technique — ask "why?" 5 times to get to the root cause.
- Test hypotheses: Make one change at a time and measure the result. Don't change multiple things at once — you won't know which fix worked.
- put in place the fix: Once the root cause is identified and the fix is verified, put in place it permanently. Update SOPs, retrain employees, and adjust equipment settings.
- Monitor results: Track the problem after the fix to ensure it's resolved. If it recurs, repeat the analysis.
7. Employee Training and Engagement
Employees are on the front line of waste reduction. Their actions (or inactions) directly impact waste levels. Engaged, well-trained employees are your most valuable asset in waste reduction.
7.1 Waste Reduction Training Program
- New hire orientation: Include waste reduction in new employee orientation. Explain why waste reduction matters (cost savings, environmental impact, job security), how to track waste, and the bakery's waste reduction goals.
- Hands-on training: Train employees on proper techniques: accurate measuring, FIFO rotation, portion control, proper handling to prevent damage, equipment operation to prevent errors, and waste logging.
- Standard operating procedures (SOPs): Create written SOPs for every task. Post SOPs near workstations. Employees should follow SOPs consistently — no improvisation.
- Regular refresher training: Conduct monthly training sessions on waste reduction topics. Focus on the top waste issues identified in waste tracking data.
- Cross-training: Cross-train employees on multiple positions. This reduces errors when employees fill in for absent coworkers, and gives employees a broader understanding of the production process.
- Performance feedback: Provide regular feedback on waste performance. see employees who consistently produce low waste. Coach employees who produce high waste — focus on training and support, not punishment.
7.2 Creating a Culture of Waste Reduction
- Lead by example: Owners and managers must show commitment to waste reduction. If management doesn't care, employees won't either.
- Share waste data with the team: Post weekly waste metrics in a visible area. Celebrate improvements. When employees see the impact of their efforts, they're more motivated to continue.
- Involve employees in solution-finding: Ask employees for ideas to reduce waste. They're closest to the work and often have the best ideas. put in place good ideas and give credit to the employee who suggested them.
- Set team goals, not individual goals: Waste reduction is a team effort. Set team-based waste reduction goals and reward the whole team when goals are met. Individual goals can create unhealthy competition and under-reporting of waste.
- Reward success: When the team achieves a waste reduction goal, celebrate — pizza party, bonus, extra break, or other recognition. Positive reinforcement is more effective than punishment.
- Make waste reduction part of the bakery's identity: Talk about waste reduction regularly. Frame it as "we're a bakery that cares about quality, efficiency, and the environment." Make it a source of pride.
8. Equipment Maintenance and Calibration
Well-maintained equipment produces consistent, high-quality products with fewer errors. Poorly maintained equipment causes waste through inconsistent portioning, inaccurate temperatures, and unexpected breakdowns that ruin batches.
8.1 Equipment Maintenance Schedule
| Equipment | Daily Maintenance | Weekly Maintenance | Monthly Maintenance | Waste Impact if Neglected |
|---|---|---|---|---|
| Spiral mixer | Clean bowl, hook, and exterior; check for unusual noises | Check belt tension; lubricate (if required); check power cord | Professional checkion; check motor bearings; check mixing performance | Inconsistent dough development, over/under-mixed dough, motor burnout ruining batches |
| Dough divider/rounder | Clean all dough-contact parts; check portion weights; lubricate (per instructions) | Calibrate portion weights (±2%); check cutting blades; check drive system | Professional service; replace worn blades/belts; check accuracy | Inconsistent portion sizes (waste from over/under-sized products), jams ruining dough |
| Proofing cabinet | Check temp/humidity; clean interior; check water level (steam models) | Calibrate temp/humidity; clean heating elements; check door seal | Professional checkion; replace sensors if inaccurate; deep clean | Under/over-proofed products (waste from poor quality), inconsistent proofing |
| Rotary/deck oven | Clean interior; check oven temp (thermometer); check door seal; check burner/part | Calibrate oven temp; clean vents/exhaust; check rotation (rotary); check steam injection | Professional service; check gas pressure/electrical; calibrate thermostat; deep clean | Burnt/under-baked products (large waste), uneven baking, energy waste |
| Dough moulder | Clean rollers and surfaces; check roller gap; check for dough buildup | Check roller coating condition; lubricate (per instructions); check belt tension | Professional checkion; replace worn rollers/belts; check shaping consistency | Misshapen products (waste), dough sticking/tearing (waste), inconsistent shaping |
| Refrigeration/cooler | Check temp; clean exterior; check door seal; remove expired items | Clean condenser coils; check temp calibration; check door gaskets | Professional service; check refrigerant level; replace gaskets if needed; deep clean | Spoiled ingredients (large waste), temperature fluctuations affecting product quality |
8.2 Equipment Calibration
Calibration ensures equipment performs accurately. Inaccurate equipment causes waste through inconsistent results:
- Digital scales: Calibrate monthly with a known weight (e.g., 1kg standard weight). Replace batteries regularly. Keep scales clean and on stable surfaces.
- Oven thermostats: Calibrate monthly with an oven thermometer. Oven thermostats can drift by 25-50°F (15-30°C), causing burnt or under-baked products.
- Proofing cabinet: Calibrate temperature and humidity monthly with a separate thermometer/hygrometer.
- Dough divider: Calibrate portion weights weekly. Weigh 10 consecutive pieces and calculate average and range. Adjust if average is off target or range exceeds ±2%.
- Refrigerator/freezer thermometers: Calibrate quarterly with a separate thermometer. Keep a log of daily temperatures.
- Timers: check timer accuracy quarterly (compare with a stopwatch). Inaccurate timers cause over/under-baking.
9. Product Shelf Life Extension
Extending product shelf life reduces waste by giving products more time to sell before going stale. This is particularly important for artisan breads and pastries with short shelf life.
9.1 Shelf Life Extension Techniques
- Proper cooling: Cool products fully to room temperature before packaging. Packaging warm products causes condensation, which accelerates staling and mold growth.
- Appropriate packaging: Use packaging that protects products from air and moisture. For breads: polypropylene bags with twist ties or heat seals. For pastries: individual bags or clamshell containers. For crusty breads: paper bags (to maintain crust) or breathable packaging.
- Modified atmosphere packaging (MAP): For high-volume products, consider MAP — replacing oxygen in the package with nitrogen/CO2 to extend shelf life by 2-3 times. Requires specialized equipment.
- Natural preservatives: Use natural preservatives to extend shelf life: cultured wheat (inhibits mold), vinegar (lowers pH), enzymes (improve softness), ascorbic acid (improves dough strength). These are clean-label alternatives to chemical preservatives.
- Formula optimization: Adjust recipes to improve shelf life: slightly higher fat content (slows staling), higher sugar content (retains moisture), use of dough conditioners/enzymes, longer fermentation (improves flavor and shelf life).
- Freezing: For products that can be frozen (breads, some pastries, dough), freeze immediately after cooling. Frozen products have 1-3 month shelf life. Thaw at room temperature or in oven before sale. Freezing is one of the most effective waste reduction strategies for retail bakeries.
- Storage conditions: Store products in cool, dry, dark areas. Avoid temperature fluctuations. Don't store bread in the refrigerator (accelerates staling). Store at room temperature for 1-2 days, or freeze for longer storage.
10. Day-Old Product Strategies
Even with the best production planning, you'll have day-old products. Have a clear plan for day-old products to minimize waste and maximize value.
10.1 Day-Old Product Options
| Plan | Best For | Value Recovery | Notes |
|---|---|---|---|
| Discount sale (20-50% off) | Breads, bagels, muffins, cookies | 50-80% of full price | Create a "day-old" section; clearly label; many customers seek discounts |
| Repurpose into other products | Breads, cakes, pastries | 100%+ (new product value) | Bread crumbs, croutons, bread pudding, French toast, stuffing, bread bowls; cake pops, trifle |
| Freeze for later use/sale | Breads, rolls, some pastries, dough | 70-100% (when sold later) | Freeze immediately after cooling; label with date; use within 1-3 months; thaw before sale |
| Donate to food banks/shelters | All safe-to-eat products | Tax deduction + goodwill | Partner with local food banks; many provide pickup; tax-deductible in many countries; good for community relations |
| Employee meals/discounts | All safe-to-eat products | Employee benefit + morale | Offer free or discounted day-old products to employees; boosts morale and reduces waste |
| Compost | Products that can't be used/donated | Environmental benefit | Compost in-house or with local composting service; use compost for garden/landscaping; reduces landfill methane |
| Animal feed | Breads, grains (safe for animals) | Minimal (may be free) | Partner with local farms/animal shelters; ensure products are safe for animal consumption; check local regulations |
11. Donation and Composting Programs
11.1 Food Donation Program
- Find local partners: Contact local food banks, soup kitchens, shelters, and food rescue organizations. Many will pick up donations regularly.
- Ensure food safety: Only donate products that are safe to eat (not moldy, contaminated, or past safe consumption). Maintain proper storage and handling.
- Document donations: Keep records of donations (date, product, quantity, estimated value) for tax deductions. Get receipts from the receiving organization.
- Understand liability protection: Many countries (including the US under the Bill Emerson Good Samaritan Food Donation Act) provide liability protection for food donors. Donating safe food in good faith is generally protected.
- Promote your donation program: Tell customers about your donation efforts. It builds goodwill, improves your brand, and may attract customers who value social responsibility.
11.2 Composting Program
- Separate compostable waste: Set up separate bins for food waste (compostable), recycling, and landfill. Clearly label bins and train employees.
- Choose a composting method: In-house composting (for small amounts, requires space and management) or commercial composting service (pickup by local composting company).
- What to compost: Bread scraps, flour, dough, fruit/vegetable peels, coffee grounds, eggshells, paper packaging (uncoated). Do NOT compost: meat, dairy, oils, plastic, coated paper, metal.
- Use compost: If composting in-house, use the finished compost for landscaping, herb garden, or employee garden. If using a service, the compost is used by local farms/gardens.
- Track composting volume: Weigh compostable waste and track volume. This helps measure waste reduction progress and may reduce landfill disposal costs (many waste haulers charge by weight).
12. Packaging Waste Reduction
Packaging waste is often overlooked but can add up noticeably. Reducing packaging waste saves money and is environmentally responsible.
- Right-size packaging: Use packaging that fits the product properly — not too large (wastes material) and not too small (damages product). Test different packaging sizes to find the optimal fit.
- Reduce packaging layers: Do you need both an inner bag and an outer box? Can you remove one layer? Many products are over-packaged. Simplify where possible.
- Use recyclable/compostable materials: Switch to recyclable paper, cardboard, or compostable materials (PLA, paper-based). This reduces environmental impact and may appeal to eco-conscious customers.
- Buy in bulk: Purchase packaging materials in bulk to reduce per-unit cost and packaging waste from shipping. Store properly to prevent damage.
- Reuse where possible: Reuse clean delivery boxes, ingredient containers (for storage), and packaging materials. Just ensure food safety (don't reuse packaging that directly contacts ready-to-eat food).
- Print labels accurately: Misprinted labels are wasted. Double-check label content before printing. Use label software with templates to reduce errors.
- Train employees on packaging: Train employees to use the right amount of packaging — not too much (waste) and not too little (product damage). show proper packaging techniques.
13. Energy and Water Conservation
While not "food waste," energy and water waste are meaningful cost drains in bakeries. Reducing utility consumption saves money and is environmentally responsible.
13.1 Energy Conservation
- Oven efficiency: Keep oven doors closed (each opening drops temp by 25-50°F and wastes energy). Preheat only If needed. Load ovens efficiently (full loads, not partial). Use oven thermal blankets (for some oven types). Maintain oven door seals.
- Lighting: Switch to LED lighting (uses 75% less energy than incandescent, lasts 25 times longer). Install motion sensors in storage areas, restrooms, and offices. Turn off lights when not in use.
- Refrigeration: Keep condenser coils clean (dirty coils reduce efficiency by 30%+). Check door seals regularly. Don't overstock (blocks airflow). Keep refrigerators away from heat sources (ovens, direct sunlight). Set appropriate temperatures (34-38°F for refrigerators, 0°F for freezers).
- HVAC: Change air filters regularly. Install programmable thermostats. Use exhaust fans efficiently (turn off when not needed). Maintain HVAC equipment annually. Consider energy-efficient HVAC upgrades.
- Equipment: Turn off equipment when not in use (don't leave mixers, proofers, lights running overnight). Use energy-efficient equipment (Energy Star certified). Unplug small appliances when not in use (phantom power drain).
- Monitor energy use: Track monthly energy bills. Calculate energy cost per unit of production. Set energy reduction goals. Conduct an energy look over (many utility companies offer free look overs).
13.2 Water Conservation
- Fix leaks promptly: A dripping faucet can waste 3,000+ gallons/year. Check faucets, pipes, and equipment regularly for leaks. Fix immediately.
- Install low-flow fixtures: Low-flow faucets, pre-rinse sprayers, and toilets reduce water use by 30-50%. Many are inexpensive and pay for themselves quickly.
- improve cleaning: Don't let water run continuously while cleaning. Use three-compartment sink method (wash, rinse, sanitize) instead of running water. Use squeegees to remove water from floors instead of hosing down.
- Reuse water where safe: Capture and reuse cooling water (from equipment) for cleaning (non-food-contact surfaces). Use rainwater for landscaping (if allowed).
- Train employees: Train employees on water conservation — turn off water when not in use, report leaks, use efficient cleaning methods.
- Monitor water use: Track monthly water bills. Set water reduction goals. spot high-water-use activities and find ways to reduce.
14. Creating a Waste Reduction Action Plan
Now that you understand the strategies, create a concrete action plan for your bakery. Here's a step-by-step put in placeation roadmap:
14.1 90-Day Waste Reduction put in placeation Plan
| Phase | Timeline | Actions | Expected Results |
|---|---|---|---|
| Phase 1: Baseline | Days 1-14 | Set up waste tracking system; train employees on logging; collect 2 weeks of baseline waste data; calculate current waste rate and cost; spot top 3 waste categories and products | Clear picture of current waste; baseline metrics; identification of priority areas |
| Phase 2: Quick Wins | Days 15-30 | put in place FIFO rotation; set up proper ingredient storage; calibrate scales and ovens; put in place portion control checks; start employee training; set waste reduction goals | 5-10% waste reduction from quick wins; improved consistency; employee awareness |
| Phase 3: Production Planning | Days 31-60 | put in place data-driven production planning (from sales history); stagger baking throughout day; set par levels; monitor and adjust in real-time; put in place day-old product plan | 20-30% reduction in overproduction waste; fresher products; improved customer satisfaction |
| Phase 4: Systems and Culture | Days 61-90 | Create standardized recipe manual; put in place quality control checks; set up donation/composting program; put in place packaging waste reduction; create waste reduction culture (team goals, rewards, regular communication) | 30-50% total waste reduction; sustainable systems; engaged team; meaningful cost savings |
| Phase 5: Continuous Improvement | Ongoing | Weekly waste look overs; monthly waste look overs; quarterly goal setting; annual waste look over; continuous training; celebrate successes; share results | Waste rate maintained at 3-5%; ongoing cost savings; culture of continuous improvement |
14.2 Setting Waste Reduction Goals
- Start with your baseline: Calculate your current waste rate (total waste cost ÷ total production cost × 100).
- Set a realistic 90-day goal: Reduce waste by 30-50% from baseline. For example: from 12% to 6-8%.
- Set a long-term goal: Achieve and maintain a waste rate of 3-5% within 6-12 months.
- Break goals into specific actions: "Reduce overproduction waste by 40% in 60 days by put in placeing data-driven production planning."
- Track progress weekly: look over waste data weekly and adjust strategies as needed.
- Celebrate milestones: When you achieve a goal, celebrate with the team. Recognition motivates continued effort.
Get a Custom Quote for Your Operation
Tell us about your bakery, your production volume, and your budget. We will recommend the right equipment for your specific needs — no pressure, no obligation.
Get Free Equipment Consultation →15. Conclusion: Waste Reduction Is Profit Improvement
Waste reduction is one of the most impactful profit improvement strategies for any bakery. The typical bakery wastes 5-15% of its production, representing tens of thousands of dollars per year in lost revenue — and even more in wasted labor, energy, and overhead. Reducing waste from 10% to 5% can add $25,000-$60,000/year directly to the bottom line, with no additional sales or marketing required.
The important to successful waste reduction is a systematic, data-driven way: track and measure waste to understand where it's coming from, focus on the largest waste categories, put in place targeted strategies, and continuously monitor and improve. The most impactful strategies are: reducing overproduction through data-driven production planning (the #1 cause of bakery waste), put in placeing FIFO inventory rotation and proper storage, portion control and standardized recipes, quality control to reduce production errors, employee training and engagement, equipment maintenance and calibration, product shelf life extension, day-old product strategies, and donation/composting programs for unavoidable waste.
Waste reduction is not a one-time project — it's an ongoing commitment. Create a culture of waste reduction where every employee understands the importance of minimizing waste and is empowered to contribute ideas and improvements. Set goals, track progress, celebrate successes, and continuously improve. Over time, waste reduction becomes part of how your bakery operates — as natural as cleaning and quality control.
The financial benefits are large, but the benefits go beyond money: waste reduction is environmentally responsible (reduces landfill methane, conserves resources), improves product quality and consistency (through better systems and training), boosts employee morale and engagement (through involvement and recognition), and improves your brand reputation (customers value businesses that are socially and environmentally responsible). It's a win-win-win for your business, your employees, and the planet.
Start today — set up a waste tracking system, collect baseline data, and begin put in placeing the strategies in this guide. Within 90 days, you'll see measurable waste reduction and cost savings. Within a year, you'll wonder how you ever operated without a waste reduction program. Every bakery can benefit from waste reduction — the question is not whether to do it, but how quickly You can start.
📋 Bakery Equipment Checklist
Download our complete bakery equipment checklist with budget estimates for 5 different bakery types.
Free Bakery Equipment Checklist →📋 Bakery Equipment ROI Calculator
Use our interactive ROI calculator to see how quickly your bakery equipment investment pays off.
Calculate Your Equipment ROI →📋 Bakery Equipment Maintenance Calendar
Get our printable maintenance calendar to keep your bakery equipment running at peak performance.
Printable Maintenance Calendar →📋 Bakery Equipment Energy Cost Calculator
Estimate your bakery equipment energy costs and find ways to reduce your utility bills.
Calculate Energy Costs →Related Articles
Learn More
- 👉 Bakery Equipment Selection Complete Guide: Choose by Output & Product
- 👉 Bakery Equipment Maintenance Schedule: Daily, Weekly, Monthly, Yearly
- 👉 Dough Divider Rounder Troubleshooting: 15 Common Problems & Solutions
- 👉 Small Bakery Equipment ROI & Payback Period Calculator
- 👉 Bakery Equipment Energy Consumption & Energy Saving Guide
- 👉 Bakery Equipment Food Safety & Hygiene Compliance Complete Guide